US Economic Outlook
The first quarter of 2026 marked a sharp turn in the macro narrative. After three consecutive 25 basis point rate cuts in late 2025 brought the federal funds rate to 3.50–3.75%, the consensus outlook entering the year called for further gradual easing, contained inflation, and a continued, if uneven, expansion. That outlook was disrupted by the outbreak of conflict in the Middle East and the subsequent closure of the Strait of Hormuz in the first quarter, which reset oil prices sharply higher, reignited inflation, and stalled the Federal Reserve’s easing path. Beneath the geopolitical shock, the labor market continued its slow deterioration and consumer activity moderated.
Job growth in the first quarter remained volatile, with underlying labor market signals pointing to softening momentum. The headline unemployment rate ended the quarter at 4.3%, but the decline from 4.4% in January was driven primarily by a sharp 396,000 drop in the labor force rather than by hiring strength. Labor force participation fell to 61.9% in March, its lowest reading since late 2021. The steepest labor force participation declines have been among those younger than 25 and those 55 or older. Wage growth continued to decelerate, with average hourly earnings rising 0.2% month-over-month and 3.5% year-over-year in March, the slowest annual pace in nearly four years. Long-term unemployment remained elevated, and announced layoffs continued at a pace meaningfully above 2024 norms. The pattern is consistent with a labor market that has stopped expanding but has not yet broken.
Inflation re-accelerated meaningfully in March, primarily as a function of the energy shock. Brent crude rose 51% in March alone, one of the largest one-month increases on record. US retail gasoline prices exceeded $4.00 per gallon as of March 31, up approximately 30% from a year prior. Headline Personal Consumption Expenditures (PCE) inflation rose 3.5% year-over-year in March, with prices up 0.7% month-over-month, the largest single-month increase since 2022. Core PCE accelerated to 3.2% year-over-year, up from 3.0% in February, with prices rising 0.3% month-over-month. While energy was the largest contributor to the headline acceleration, the uptick in core PCE indicates that price pressures are beginning to broaden beyond the energy sector.
Consumer activity moderated through the quarter, with personal consumption growth slowing to a 1.6% annualized rate, down from 1.9% in the fourth quarter of 2025. Consumer behavior continues to bifurcate. Higher-income households remain the marginal driver of spending growth, while lower- and middle-income households face renewed pressure from energy costs, persistent food inflation, and elevated debt service burdens. The K-shaped pattern that emerged in 2024 has only deepened entering 2026.
Against this backdrop, the Federal Reserve held the target range for the federal funds rate at 3.50–3.75% through three FOMC meetings in 2026, with internal disagreement deepening among Fed voting members. At the March meeting, the Committee voted 11–1 to hold rates, with the one dissent in favor of a 25 basis point cut. At the April meeting, dissent broadened materially. The Committee voted 8–4 to hold, with one dissent again favoring a 25 basis point rate cut and three voting to hold but objecting to the inclusion of an easing bias in the statement. The four dissenting votes were the most at any FOMC meeting since 1992. In his last meeting as Fed Chair, Powell characterized policy as appropriate to balance elevated near-term inflation risks from the energy shock against a softening labor market, with the Committee in no rush to act in either direction.
Long-term yields moved higher through April as the bond market re-priced the persistence of energy-driven inflation and the implied delay in additional easing. The 10-year Treasury yield ended the first quarter near 4.2% but climbed to approximately 4.4% by April 30, with most of the move occurring in the days following the FOMC’s April decision and the release of the March PCE data. As we have previously noted, the relationship between the federal funds rate and the 10-year is not direct. Long-term yields are influenced by inflation expectations, fiscal policy, term premium, and global capital flows, and have remained elevated even as short-term rates have moved lower over the past several quarters.
The first-quarter advance GDP estimate showed real GDP growth of 2.0% on an annualized basis, supported by business investment, consumer spending, and government spending. Looking ahead, the path of monetary policy and longer-term rates will continue to be the central determinant of CRE values and transaction activity, with the Middle East conflict and the persistence of energy-driven inflation as the primary near-term swing factors.
The Commercial Real Estate Landscape
Commercial real estate remains in a phase of uneven recovery. After declining in 2023, broad CRE returns turned modestly positive in 2024 and improved further in 2025. However, the dispersion across property types has widened to levels not seen in years, driven by sector-specific demand and supply dynamics.
Senior housing has outperformed the broader NCREIF Property Index (NPI) across nearly every measurement period reported by NCREIF, with the comparative gap widest in the last year. For the full year 2025, senior housing led all NCREIF property types at a 10.6% total return versus 4.9% for the NPI, a 570 basis point margin. Over the three-year period ending December 31, 2025, which captures the most challenging stretch for CRE valuations, senior housing produced a 3.6% annualized total return while the broader NPI declined at a 0.8% annualized pace. The longer-term picture reinforces the durability of the return premium as senior housing has produced an 8.5% annualized return over the trailing 20 years versus 6.4% for the NPI, and 5.7% over the trailing 10 years versus 4.9% for the NPI. The five-year period is the lone exception, with senior housing returning 3.4% annualized versus 3.9% for the NPI, reflecting the disproportionate impact of the COVID-19 pandemic on senior housing occupancy and operating margins from 2020 through 2022. Senior housing has largely recovered and operating fundamentals support the continued return profile. According to NIC, senior housing occupancy reached 89.1% at year-end 2025, supported by a fourth consecutive year of strong net absorption combined with record-low inventory growth. Units under construction have fallen to levels last seen in 2012.
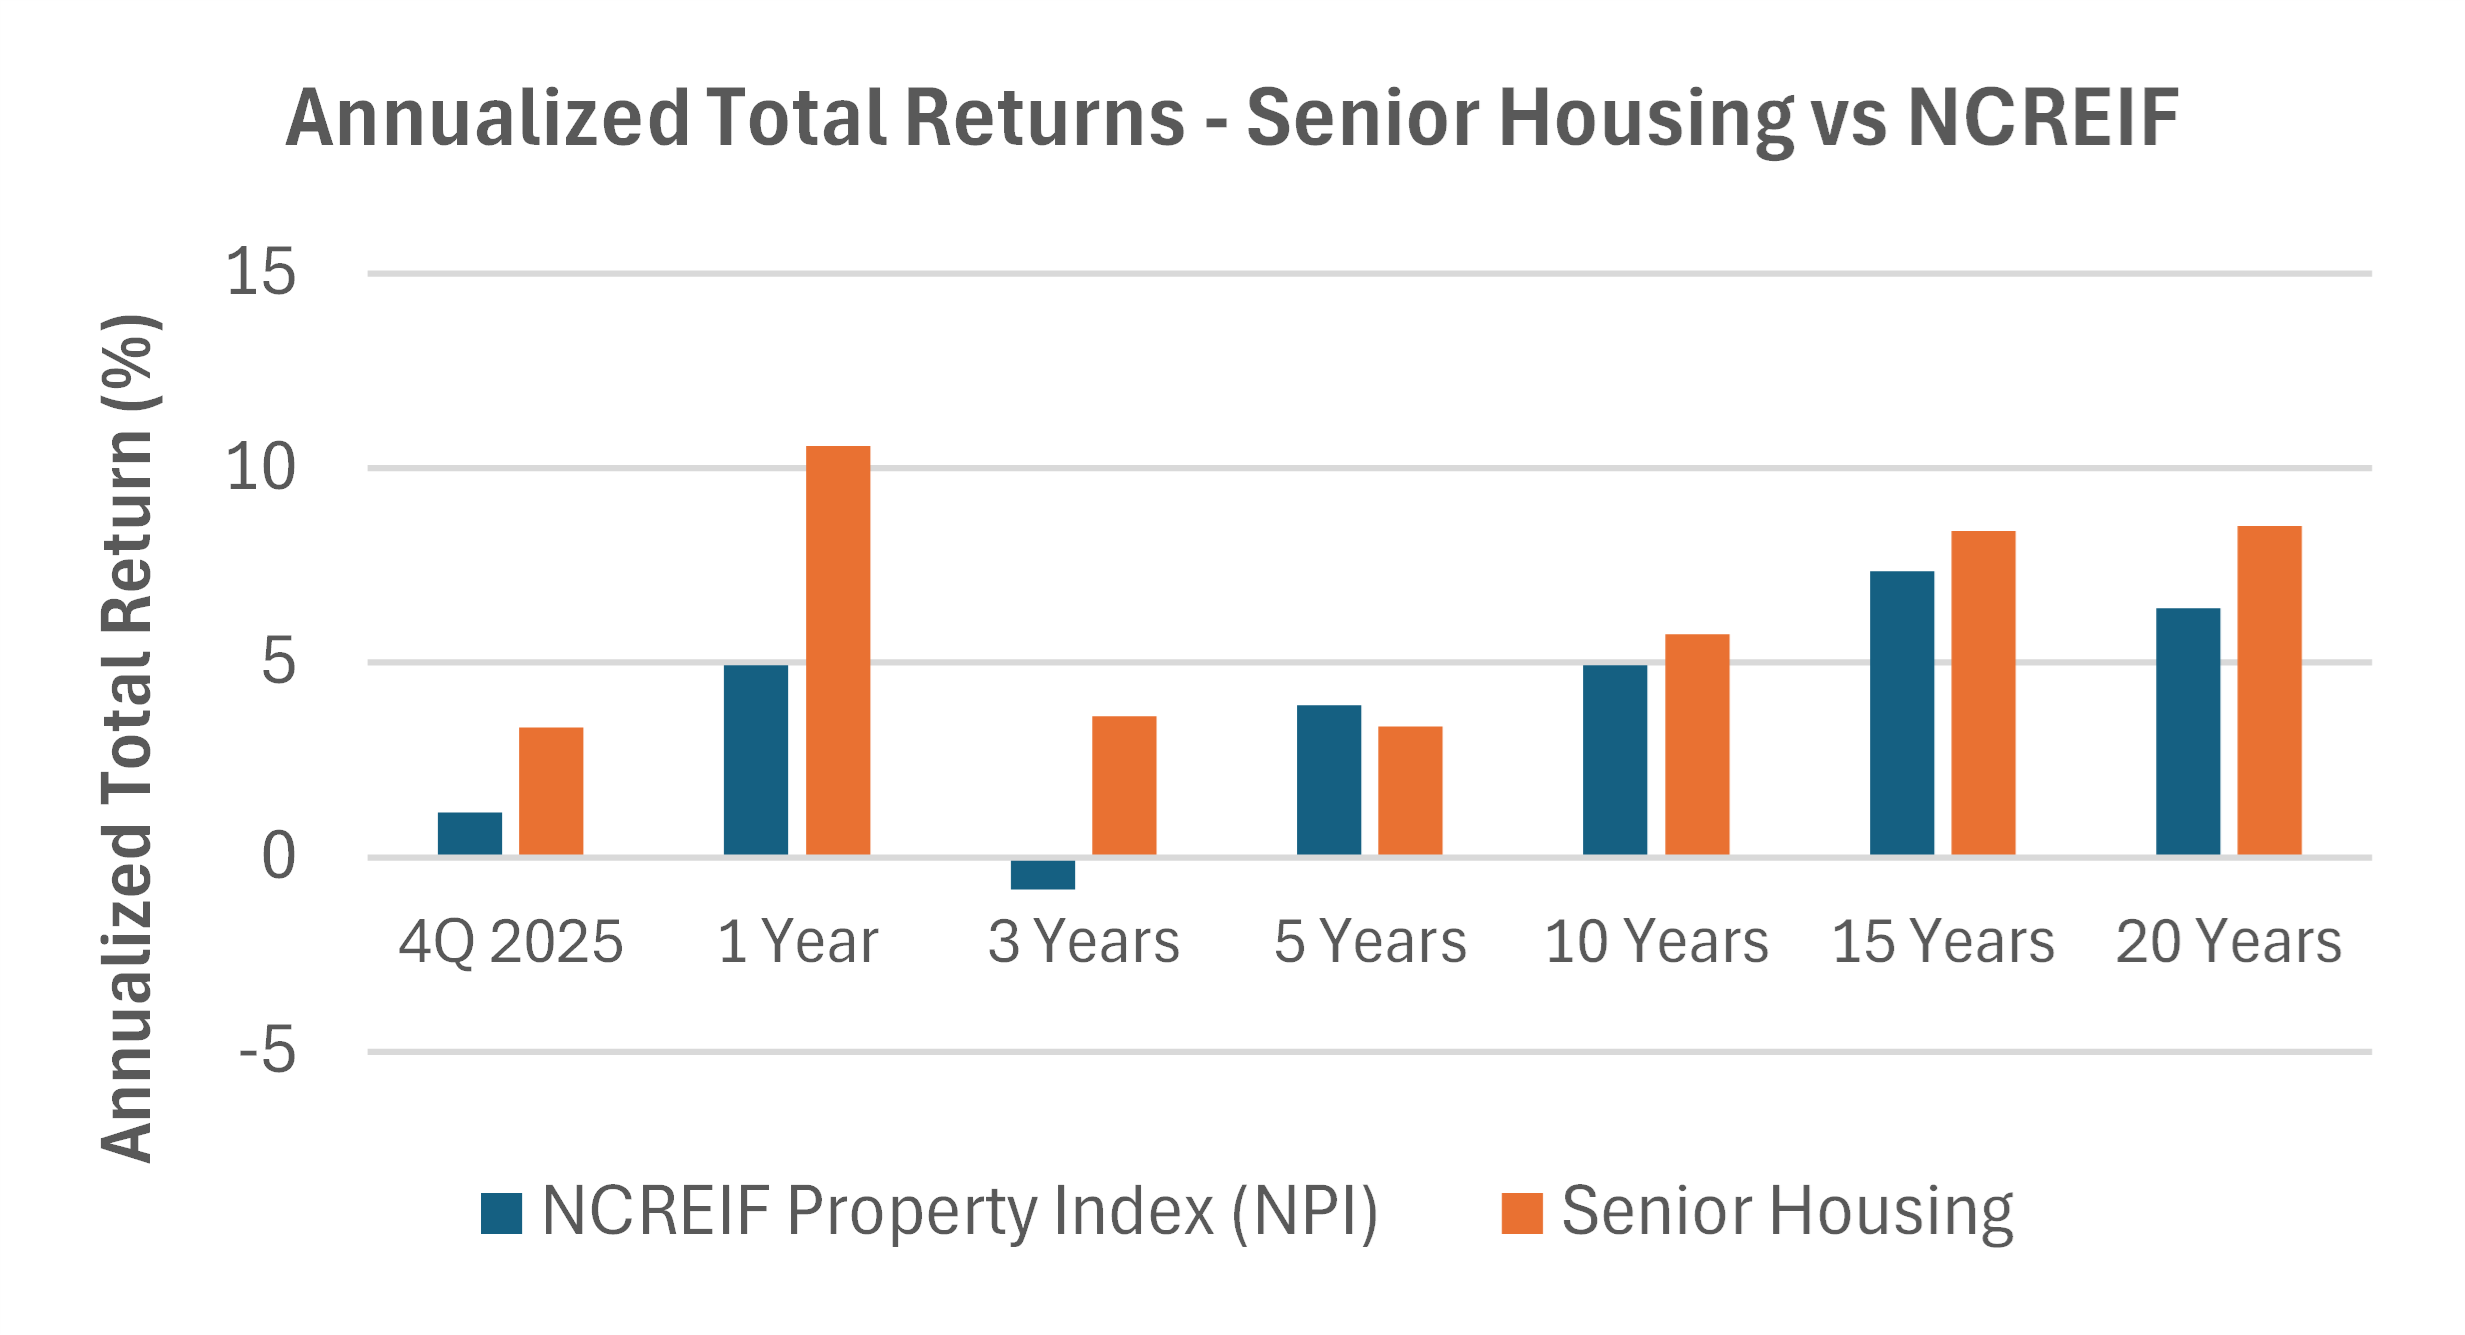
Source: NCREIF, 4Q 2025, unlevered annualized total returns. These results reflect 219 institutional senior housing properties valued at $13.6 billion within the index.
Outside senior housing, sector dynamics are mixed. Multifamily fundamentals are gradually improving as the supply wave rolls over. The trailing-twelve-month delivery total fell to approximately 380,000 units at the end of the first quarter, the first reading below 400,000 since early 2023. While first quarter 2026 net absorption of 65,200 units trailed the 100,000 absorbed a year earlier, overall construction activity has also fallen to its lowest level since 2016. The total under-construction pipeline dropped to approximately 472,000 units during Q1 2026. The second half of 2026 is largely expected to bring gradual vacancy compression and modest rent growth, though recovery timing will vary across markets. Office continues to face structural challenges. The Trepp CMBS office delinquency rate reached an all-time high of 12.3% in January 2026, before declining to below 12% in February and March, driven by loan modifications and extensions.
The Alpha Investing Strategy
Against a backdrop of accelerating inflation, a softening labor market, and a Federal Reserve that has paused its easing cycle, our investment approach remains disciplined and selective, focused on fundamentally sound real estate with outsized upside potential relative to downside risk. We continue to emphasize assets with durable in-place cash flow, conservative capital structures, fixed-rate debt or rate caps, and clear paths to value creation that do not depend on aggressive rent growth or cap rate compression.
Even as short-term rates have moved marginally lower, the spread between cap rates and longer-term Treasury yields remains compressed by historical standards. With the 10-year Treasury holding above 4.3% through April, well above the 2.0% average from 2010 to 2021, cap rates have not adjusted commensurately. As a result, we continue to underwrite transactions that prioritize current cash yield and operational improvement as the primary drivers of return. We expect transaction volume to remain measured in the near term as owners continue to pursue loan modifications and extensions over sales, and as the bid-ask spread between buyers and sellers persists.
Senior housing continues to stand out as the most attractive risk-adjusted opportunity in commercial real estate. The combination of accelerating demographic demand, supply pipelines at multi-decade lows, and a fragmented operator base creates conditions for experienced operators to acquire assets at attractive bases and drive meaningful value through better management, staffing, and operating efficiency. We can still selectively find transactions with going-in cap rates in the high single digits to low double digits in target opportunities, materially above those of competing asset classes.
We continue to evaluate other opportunities, including select single-tenant net lease (STNL) transactions that offer long-term, credit-anchored income with limited operating risk. In an environment with reduced economic visibility and renewed inflation pressure, assets with long lease terms, predictable cash flow, and tenants responsible for the majority of operating expenses provide meaningful stability when paired with conservative leverage and fixed-rate debt.
We remain cautious on multifamily acquisitions. Although deliveries are pulling back and long-term demand fundamentals remain intact, pricing in many markets does not reflect the operating cost pressures from insurance, payroll, and energy. Within multifamily, our focus is on protecting our existing portfolio and selectively evaluating structured capital opportunities where pricing reflects the risk.
Across our existing portfolio, proactive asset management remains a priority. We continue to focus on optimizing operations, controlling expenses, strengthening tenant retention, and preserving liquidity. Where appropriate, we are working with lenders to extend maturities and improve capital structures to maintain flexibility. A subset of our portfolio retains floating-rate debt with near-term maturities. We continue to secure holding power through loan modifications, additional capital, and operational improvements.
Looking ahead through 2026, our strategy is to remain patient, deploy capital selectively where risk-adjusted returns are compelling, and position the portfolio to benefit as the market moves toward a more balanced phase of the cycle.